What is Regression Analysis?
Regression analysis is a powerful statistical method used to examine the relationship between two or more variables and make predictions. It models the relationship between a dependent variable and one or more independent variables to determine the strength and character of their connection.
Types of Regression
- Simple Linear Regression: Involves two variables, one independent and one dependent
- Multiple Regression: Involves more than two variables
Prerequisites
Before beginning, ensure you have:
- Microsoft Excel installed (2010 or newer version)
- A dataset with at least two variables
- Basic understanding of statistical concepts
Preparing Your Data
Before starting the regression analysis, organize your data properly:
- Arrange data in columns with clear labels
- Remove missing values
- Ensure numerical data is properly formatted
- Verify data meets regression assumptions (linearity, homoscedasticity)
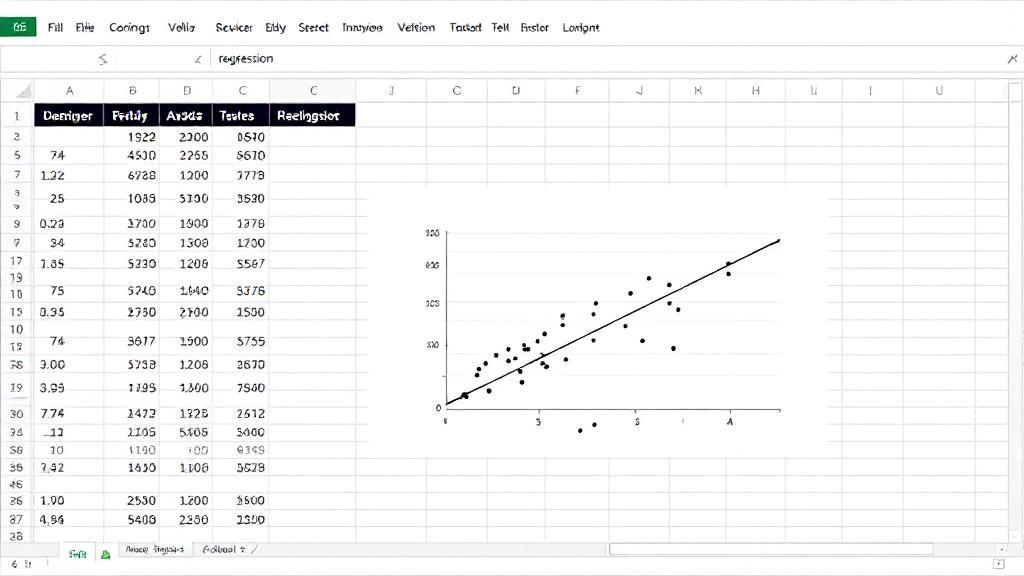
Example Data Structure
Enabling the Analysis ToolPak
- Click on File > Options
- Select Add-ins
- In the Manage box, select Excel Add-ins and click Go
- Check the Analysis ToolPak box and click OK
Performing Regression Analysis
Step 1: Access the Data Analysis Tool
- Go to the Data tab
- Click on Data Analysis in the Analysis group
Step 2: Configure the Analysis
- Select Regression from the list
- Input Y Range (dependent variable)
- Input X Range (independent variable(s))
- Check the "Labels" box if your data includes headers
- Choose output location
- Click OK
Step 3: Interpret the Results
Key statistics to review:
R-Square Value
- Located in the "Regression Statistics" table
- Indicates how well your model fits the data
- Values closer to 1 indicate better fit
P-values
- Found in the coefficients table
- Should be < 0.05 for statistical significance
- Helps determine which variables are meaningful predictors
Coefficients
- Show the relationship between variables
- Used to construct the regression equation
- Format: Y = mx + b (for simple linear regression)
Visualizing the Results
Creating a scatter plot with trendline:
- Select your data
- Go to the Insert tab
- Choose Scatter from the Charts group
- Add a Trendline by right-clicking and selecting Add Trendline
- Check "Display Equation" and "R-squared value"
Best Practices
"The quality of your regression analysis is only as good as the data you input."
Keep these tips in mind:
- Always check for outliers
- Validate assumptions about data distribution
- Document your analysis steps
- Save multiple versions of your workbook
Using Results for Forecasting
You can use the FORECAST function in Excel to make predictions:
Related Resources
Learn more about regression analysis:
- Microsoft's Guide on Regression Analysis
- Khan Academy's Introduction to Regression
- Statistics How To
Remember to validate your results and consider whether regression analysis is the appropriate tool for your specific data and research questions.